

监控go服务
来简单演示下怎么玩的。
简单的web服务
首先,写一个最简单的web服务。然后自定义一个指标,下面的代码很简单,就是访问接口的时候会往自定义指标api_http_requests_total塞数据并加1 同时也会暴漏/metrics接口。
手动调用下接口,http://127.0.0.1:8080/hello
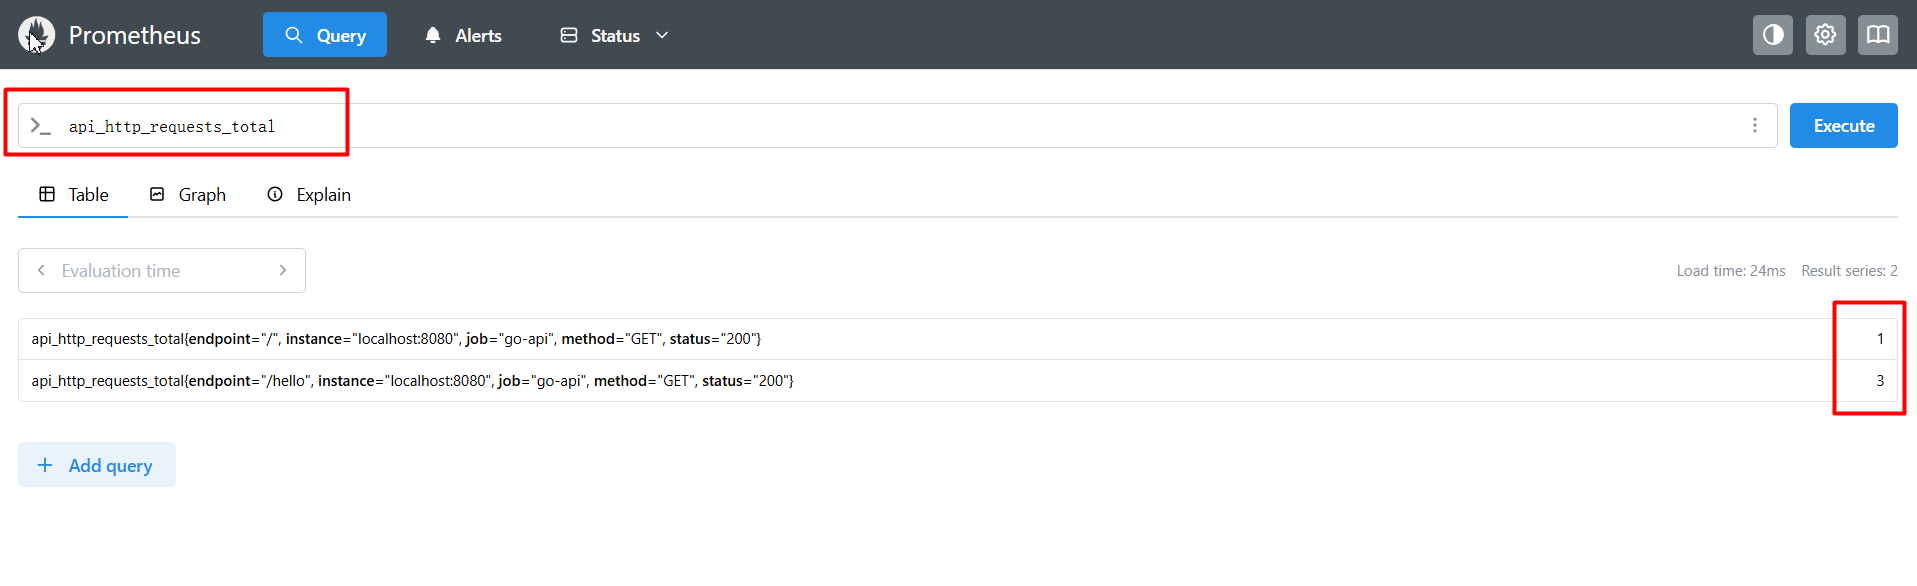
然后在 prometheus 中搜索 指标api_http_requests_total就可以搜到数据了
go
// main.go
package main

import (
	"net/http"

	"github.com/prometheus/client_golang/prometheus"
	"github.com/prometheus/client_golang/prometheus/promhttp"
)

// 可选:自定义指标(比如请求计数)
var httpRequestsTotal = prometheus.NewCounterVec(
	prometheus.CounterOpts{
		Name: "api_http_requests_total",
		Help: "Total number of HTTP requests to the API",
	},
	[]string{"method", "endpoint", "status"},
)

func init() {
	// 注册自定义指标(默认的 Go/Process 指标会自动注册,无需手动)
	prometheus.MustRegister(httpRequestsTotal)
}

func handler(w http.ResponseWriter, r *http.Request) {
	// 处理业务逻辑
	w.WriteHeader(http.StatusOK)
	w.Write([]byte("Hello from Go API!"))

	// 记录指标
	httpRequestsTotal.WithLabelValues(r.Method, r.URL.Path, "200").Inc()
}

func main() {
	http.HandleFunc("/hello", handler)
	http.HandleFunc("/", func(w http.ResponseWriter, r *http.Request) {
		w.WriteHeader(http.StatusOK)
		w.Write([]byte("OK"))
		httpRequestsTotal.WithLabelValues(r.Method, r.URL.Path, "200").Inc()
	})

	// 暴露 Prometheus 指标端点
	http.Handle("/metrics", promhttp.Handler())

	println("Go API server running on :8080")
	if err := http.ListenAndServe(":8080", nil); err != nil {
		panic(err)
	}
}修改prometheus的监控配置
yaml
# my global config
global:
  scrape_interval: 15s # Set the scrape interval to every 15 seconds. Default is every 1 minute.
  evaluation_interval: 15s # Evaluate rules every 15 seconds. The default is every 1 minute.
  # scrape_timeout is set to the global default (10s).

# Alertmanager configuration
alerting:
  alertmanagers:
    - static_configs:
        - targets:
          # - alertmanager:9093

# Load rules once and periodically evaluate them according to the global 'evaluation_interval'.
rule_files:
  # - "first_rules.yml"
  # - "second_rules.yml"

# A scrape configuration containing exactly one endpoint to scrape:
# Here it's Prometheus itself.
scrape_configs:
  # The job name is added as a label `job=<job_name>` to any timeseries scraped from this config.
  - job_name: "prometheus"

    # metrics_path defaults to '/metrics'
    # scheme defaults to 'http'.

    static_configs:
      - targets: ["localhost:9090"]
       # The label name is added as a label `label_name=<label_value>` to any timeseries scraped from this config.
        labels:
          app: "prometheus"
   # 2. 监控你的 Go API 服务(关键!!!)
  - job_name: 'go-api'
    static_configs:
      - targets: ['localhost:8080']   # 这里是你的服务地址
    metrics_path: '/metrics'         # 默认就是 /metrics,可省略
    scrape_interval: 5s             # 可选:更频繁抓取