

prometheus
安装地址:https://software.share888.top/note/devtool/detail/prometheus.html
官方exporter下载地址:
优秀博客推荐:https://flowus.cn/literator_ray/share/a138cb0e-07ec-4fae-8ae1-f75a0590816c
🧠 一、Prometheus 的工作原理
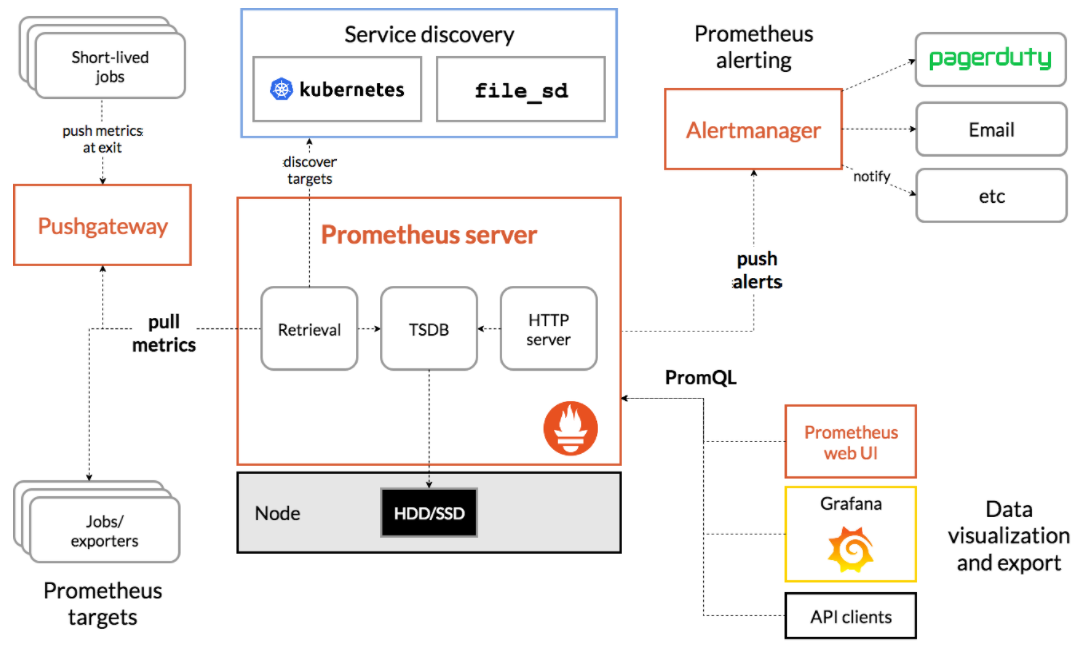
Prometheus 是一个 基于拉取(pull-based)模型 的监控系统。它的核心思想是:
- 被监控的服务(或通过 Exporter)暴露一个 HTTP 接口(通常是
/metrics),以文本格式返回指标数据。 - Prometheus 定期(比如每15秒)主动去“拉取”这些指标。
- 拉取回来的数据存储在本地时序数据库(TSDB)中。
- 用户可以通过 PromQL 查询语言对这些数据进行分析、告警、可视化等。
注意:这与 Zabbix、Nagios 等传统监控工具的“推模式”不同。
🛠️ 二、Prometheus 架构简图
+------------------+       +------------------+
|   Your Service   |<----->|   Exporter (可选)|
+------------------+       +------------------+
         |                         |
         | 暴露 /metrics           | 暴露 /metrics
         v                         v
+--------------------------------------------------+
|                Prometheus Server                 |
| - 定期抓取目标(scrape)                        |
| - 存储时序数据                                   |
| - 提供 PromQL 查询接口                          |
| - 可配置 Alertmanager 发送告警                  |
+--------------------------------------------------+
         |
         v
+------------------+
| Grafana (可选)   | <-- 可视化展示
+------------------+🔧 三、如何监控不同类型的服务?
1. 监控本机(Windows/Linux 服务器)
你需要使用 Node Exporter(官方提供的 exporter):
- 下载地址:https://github.com/prometheus/node_exporter
- 启动后,默认监听
:9100/metrics - 它会暴露 CPU、内存、磁盘、网络等系统指标
✅ Windows 上运行示例:
bash
# 解压 node_exporter-*.windows-amd64.zip
cd node_exporter-*.windows-amd64
.\node_exporter.exe然后访问 http://localhost:9100/metrics 看到指标即成功。
2. 监控 Go Web 服务
如果你用的是 Go 写的 Web 服务,可以非常方便地集成 Prometheus 客户端库:
go
// main.go
package main

import (
	"net/http"

	"github.com/prometheus/client_golang/prometheus"
	"github.com/prometheus/client_golang/prometheus/promhttp"
)

// 可选:自定义指标(比如请求计数)
var httpRequestsTotal = prometheus.NewCounterVec(
	prometheus.CounterOpts{
		Name: "api_http_requests_total",
		Help: "Total number of HTTP requests to the API",
	},
	[]string{"method", "endpoint", "status"},
)

func init() {
	// 注册自定义指标(默认的 Go/Process 指标会自动注册,无需手动)
	prometheus.MustRegister(httpRequestsTotal)
}

func handler(w http.ResponseWriter, r *http.Request) {
	// 处理业务逻辑
	w.WriteHeader(http.StatusOK)
	w.Write([]byte("Hello from Go API!"))

	// 记录指标
	httpRequestsTotal.WithLabelValues(r.Method, r.URL.Path, "200").Inc()
}

func main() {
	http.HandleFunc("/hello", handler)
	http.HandleFunc("/", func(w http.ResponseWriter, r *http.Request) {
		w.WriteHeader(http.StatusOK)
		w.Write([]byte("OK"))
		httpRequestsTotal.WithLabelValues(r.Method, r.URL.Path, "200").Inc()
	})

	// 暴露 Prometheus 指标端点
	http.Handle("/metrics", promhttp.Handler())

	println("Go API server running on :8080")
	if err := http.ListenAndServe(":8080", nil); err != nil {
		panic(err)
	}
}这样你的服务就自带 /metrics 接口了!
3. 监控 MySQL
使用官方 mysqld_exporter:
- 下载:https://github.com/prometheus/mysqld_exporter
- 需要创建一个只读监控用户给 exporter 使用
- 启动后监听
:9104/metrics
配置示例(Windows):
bash
set DATA_SOURCE_NAME="user:password@(localhost:3306)/"
.\mysqld_exporter.exe4. 监控消息队列(如 RabbitMQ、Kafka)
- RabbitMQ:使用 rabbitmq_exporter 或启用 RabbitMQ 自带的 Prometheus 插件(3.8+ 版本原生支持)
- Kafka:使用 kafka_exporter 或通过 JMX + jmx_exporter
📄 四、配置 Prometheus 抓取目标
你现在需要编辑 prometheus.yml(通常在安装目录下),告诉 Prometheus 去哪里抓取数据。
例如:
yaml
global:
  scrape_interval: 15s

scrape_configs:
  # 监控 Prometheus 自身
  - job_name: 'prometheus'
    static_configs:
      - targets: ['localhost:9090']

  # 监控本机(需先运行 node_exporter)
  - job_name: 'node'
    static_configs:
      - targets: ['localhost:9100']

  # 监控你的 Go Web 服务(假设运行在 8080)
  - job_name: 'my-go-app'
    static_configs:
      - targets: ['localhost:8080']

  # 监控 MySQL
  - job_name: 'mysql'
    static_configs:
- targets: ['localhost:9104']保存后,重启 Prometheus 或发送 SIGHUP 重载配置(Windows 下建议重启)。
然后访问 http://localhost:9090/targets,查看所有目标是否为 UP 状态。
🔍 五、验证和查询
- 访问
http://localhost:9090/graph - 输入指标名,比如:
up→ 查看所有目标是否存活node_cpu_seconds_total→ CPU 使用情况go_goroutines→ Go 程序的协程数mysql_global_status_threads_connected→ MySQL 连接数
📊 六、进阶:可视化(Grafana)
虽然 Prometheus 自带简单 UI,但生产环境通常搭配 Grafana:
- 下载 Grafana(https://grafana.com/grafana/)
- 启动后访问
http://localhost:3000 - 添加数据源:选择 Prometheus,URL 填
http://localhost:9090 - 导入现成 Dashboard(如 Node Exporter 的 ID: 1860)